In our recent website migration checklist article, we walked you through the planning and execution of a range of different site migration scenarios.
Your next order of business will be to monitor organic performance and work out whether the migration was a success.
Introduction
In this guide, we provide you with the means to monitor the progress of site migrations involving a change of website property – this could be a change of root domain, subdomain or protocol.
Keeping an eye on the progress of such a migration can be very time-consuming task owing to the need to monitor multiple sites (e.g. old domain vs. new domain) and multiple data sources (e.g. Google Search Console and Google Analytics).
For larger sites, the volume of data involved can further complicate matters.
This guide and accompanying Data Studio template will save you from having to flip back and forth between Analytics and Search Console, applying filters and exporting data to perform your evaluations, making the task a cinch.
Things you will need
In its simplest form, the only essential resource you will need access to other than Data Studio is Google Search Console and the Search Console properties you would like to track pre- and post- migration. This might include different protocol variants such as HTTP and HTTPS.
Depending on your needs and reporting preferences you may want to add other data sources. As an example, we’ve included visibility plots from Sistrix in our template, which provides a view of overall “visibility”. Note however for that to work, you would need access to a Sistrix account which includes API access. Information on how to set that up can be found here.
Further plots could easily be included to track the data that’s important to your business such as conversions or revenue, by pulling it in from Google Analytics.
What the dashboard reports
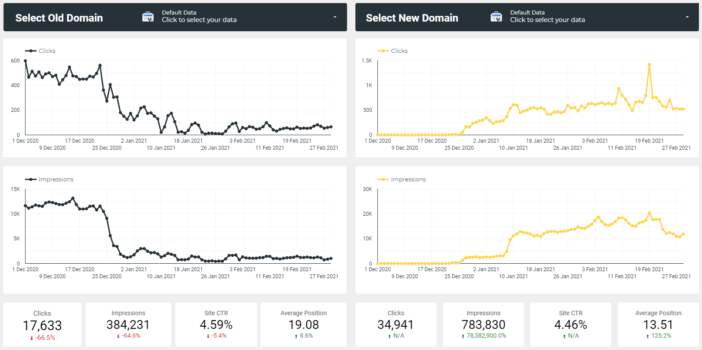
The Data Studio dashboard gives you an easy side by side comparison of the old and new domain as part of your migration, monitoring clicks, impressions, CTR and average position. These sections compare the date selected with the previous period:
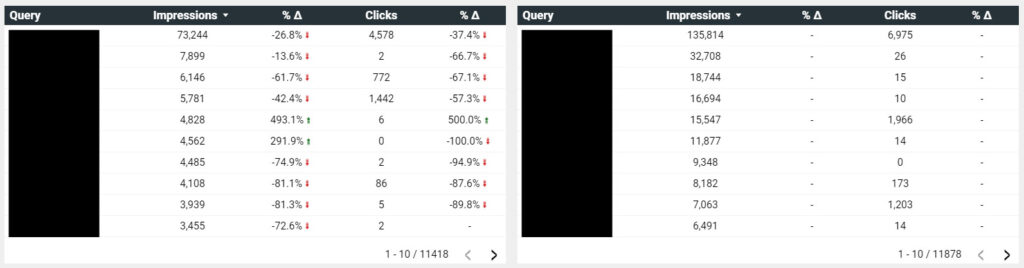
You can then compare top performing keywords to see impressions and clicks are dropping for the old domain and increasing for the new. Again, these tables compare the performance of the date range selected with the previous period:
We thought it would be handy to be able to look at data for URLs and to be able to filter this to a single URL or a group, looking at clicks and impressions comparing to the previous period:

We have defaulted these graphs to look at impressions but hovering over the top right of the graphs reveals an icon labelled Option Metrics. Selecting this allows you to add other metrics to the graph such as clicks.

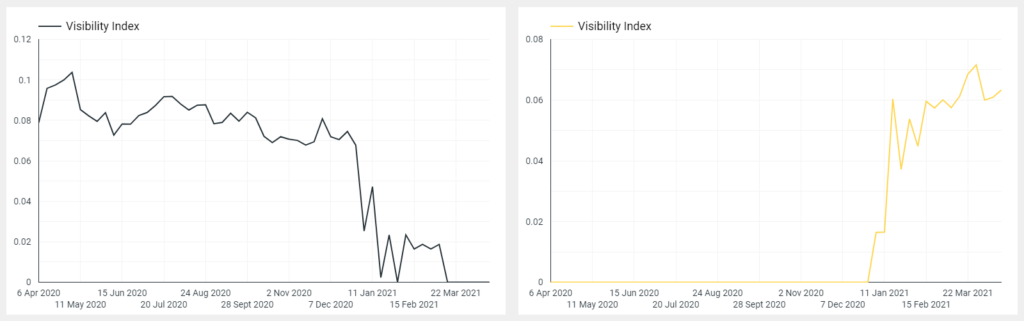
We use Sistrix for our client reports, so including these graphs is useful as it provides a familiar point of reference for top level visibility and whether or not it is transferring from old to new site:
How to set up your dashboard
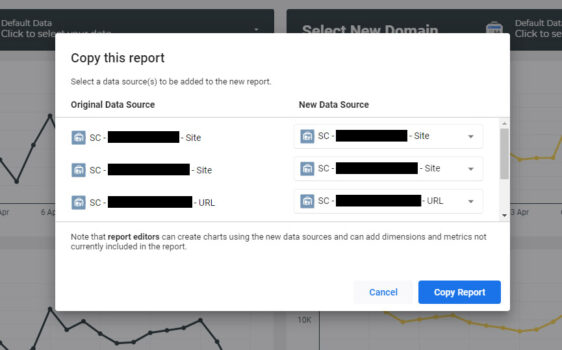
Click here to open the dashboard and click the button “make a copy of this report”.

A popup will open showing the original data sources – this is where you need to select the new data sources from your Google Search Console account. You need to add both site and URL data sources for each domain for the dashboard to work.
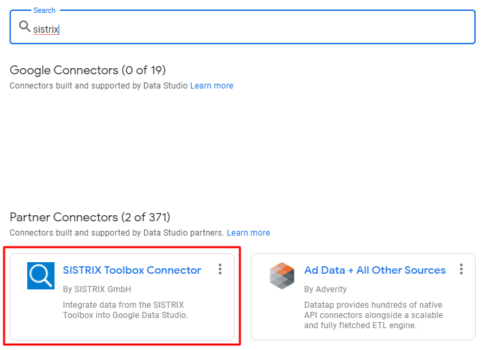
If you wish to use the Sistrix plots but haven’t set up your Sistrix data source before, in the dropdown select “create new data source”. Search for Sistrix in the connectors section, you will then need your API-key from Sistrix, just one of the domains you want to track (don’t worry, you can edit the graphs later to show both), the country and if you want the graph to show mobile or desktop data. Make sure to tick the boxes to allow the data to be modified in the report.


Editing your dashboard
You should now have a basic version of the dashboard working, but here are some things that might need attention:
If you want to track more than two domains, you can add extra data sources by clicking this button. First check that in the dropdowns where it says “select old domain” or “select new domain” the data source you want to add is not already there. This is because these dropdowns should link to your entire Search Console account and show a full list of every domain you have access to.

If you added the Sistrix data source, you might now have two Sistrix visibility graphs on the report which are the same. To change one of them edit your report and click on one of the graphs. In the data section, you will want to scroll to the bottom where it says “Parameters”.
This will let you update the domain to the second domain you want to track as well as selecting the country and if it is mobile or desktop data.

Blending data
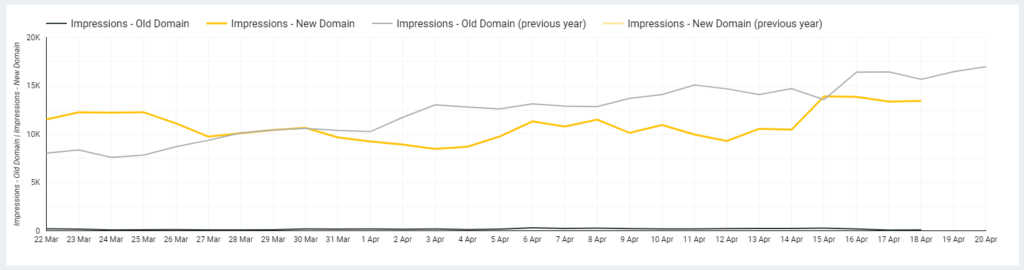
If you look at page two of the report, you will see that we added in a blended report of the old domain versus the new domain compared to the previous year. Obviously, if the domain is brand new there will not be any data for the previous year, but this report is useful to see if the traffic to the new domain now matches what the traffic to the old domain was like for the previous year.
To create these graphs, you need to:
- Create a time series graph of the old domain, which compares the date range you have selected to the previous year
- Duplicate this time series graph but change the data source to your new domain.
- Next, select both graphs, right click and select “Blend data”
- This will create a brand-new graph of the blended data, so you can now delete the original two
- Repeat this process if you want to track different things such as clicks, impressions etc
Extra things you could add
This dashboard covers the basics for you to easily spot trends, whether the website migration has gone to plan or identifying keywords/URLs that have not passed data across yet.
However, you might want to look at things like if the new domains bounce rate matches, if revenue compares to last year’s sales or even if pagespeed and Core Web Vitals data is better or worse. To do this, you will need to use the Analytics or Googles Chrome UX Report connector – these might be useful for tracking long term effects of a website migration.
If you have any issues with the dashboard, need some help adding some advanced features or need some advice on a website migration, we are happy to help! Get in touch with us here.
Click Here For The Migration Data Studio Dashboard